| Name | Class | Major | College | Color | Height | Siblings | Group |
|---|---|---|---|---|---|---|---|
| Lauren | Sophomore | Biological science | STEM | Red | 5’0” | 1 sibling | Group 2 |
| Olivia | Sophomore | Biological science | STEM | Red | 5’5” | 3 siblings | Group 2 |
| Lana | Junior | Environmental science | STEM | purple | 5’3” | 5 siblings | Group 2 |
| Jasmine | Sophomore | Kinesology | STEM/Health | Pink | 5’10” | 7 siblings | Group 2 |
| Amanda | freshman | Nursing | HHS | Pink | 5’1 | 0 | 3 |
| Ava | freshman | occupational therapy | HHS | green | 5’6 | 3 | 3 |
| Coyden | freshman | Environmental science | SET | blue | 5’10 | 1 | 3 |
| Riley | Junior | Exercis Science | HHS | Green | 6’3 | 0 | 3 |
| Julia | nontraditional (Junior) | med lab sciences | HHS | blue | 5’10 | 6 | 3 |
| Fatimah | Freshman | Neuroscience | NA | All colors | 5’6 | only child | Group 4 |
| Conor | Freshmen | Biology | NA | green | 5’8 | 2 siblings | Group 4 |
| Elizabeth | sophomore | Psych | NA | Pink/Brown | 5’5 | 5 sib (1 bio) | Group 4 |
| Nastia | freshmen | exercise science | NA | navy | 5’5 | 1 sibling | Group 4 |
| Ethan | freshman | nursing | science/medicane | blue | 5’7 | 2 | 1 |
| Lincoln | Sophomore | biology | science | purple | 5’9 | 1 | 1 |
| Emma | junior | CMB | science | black | 5’4 | 2 | 1 |
Math 132B
Class 5
Categorical Variables
- Frequency Table
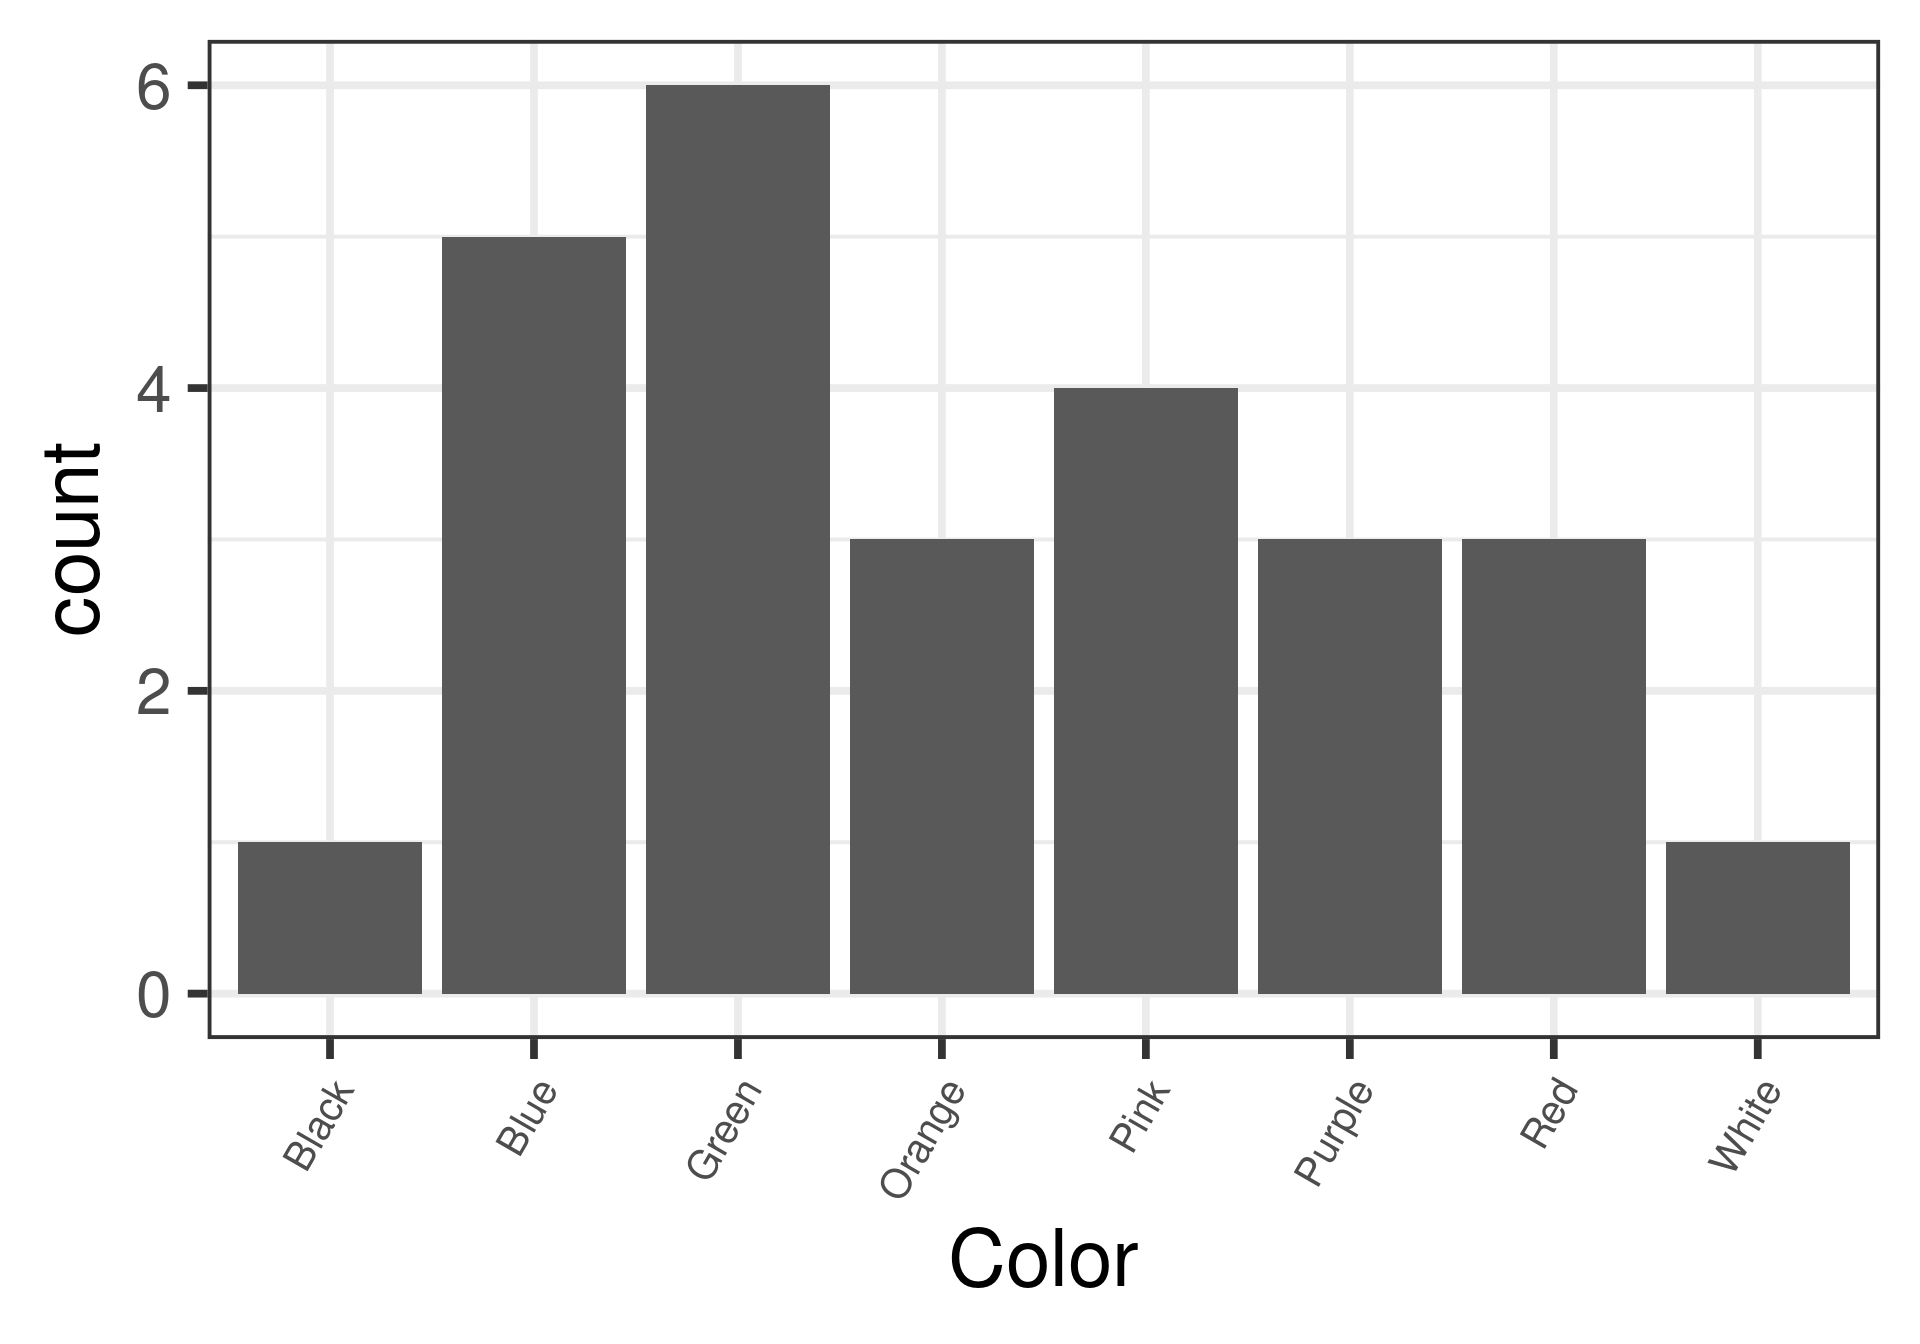
| Color | Freq |
|---|---|
| All Colors | 1 |
| Black | 1 |
| Blue | 3 |
| Green | 3 |
| Navy | 1 |
| Pink | 2 |
| Pink/Brown | 1 |
| Purple | 2 |
| Red | 2 |
- Bar Graph
… (another option)
- Relative Frequency Table
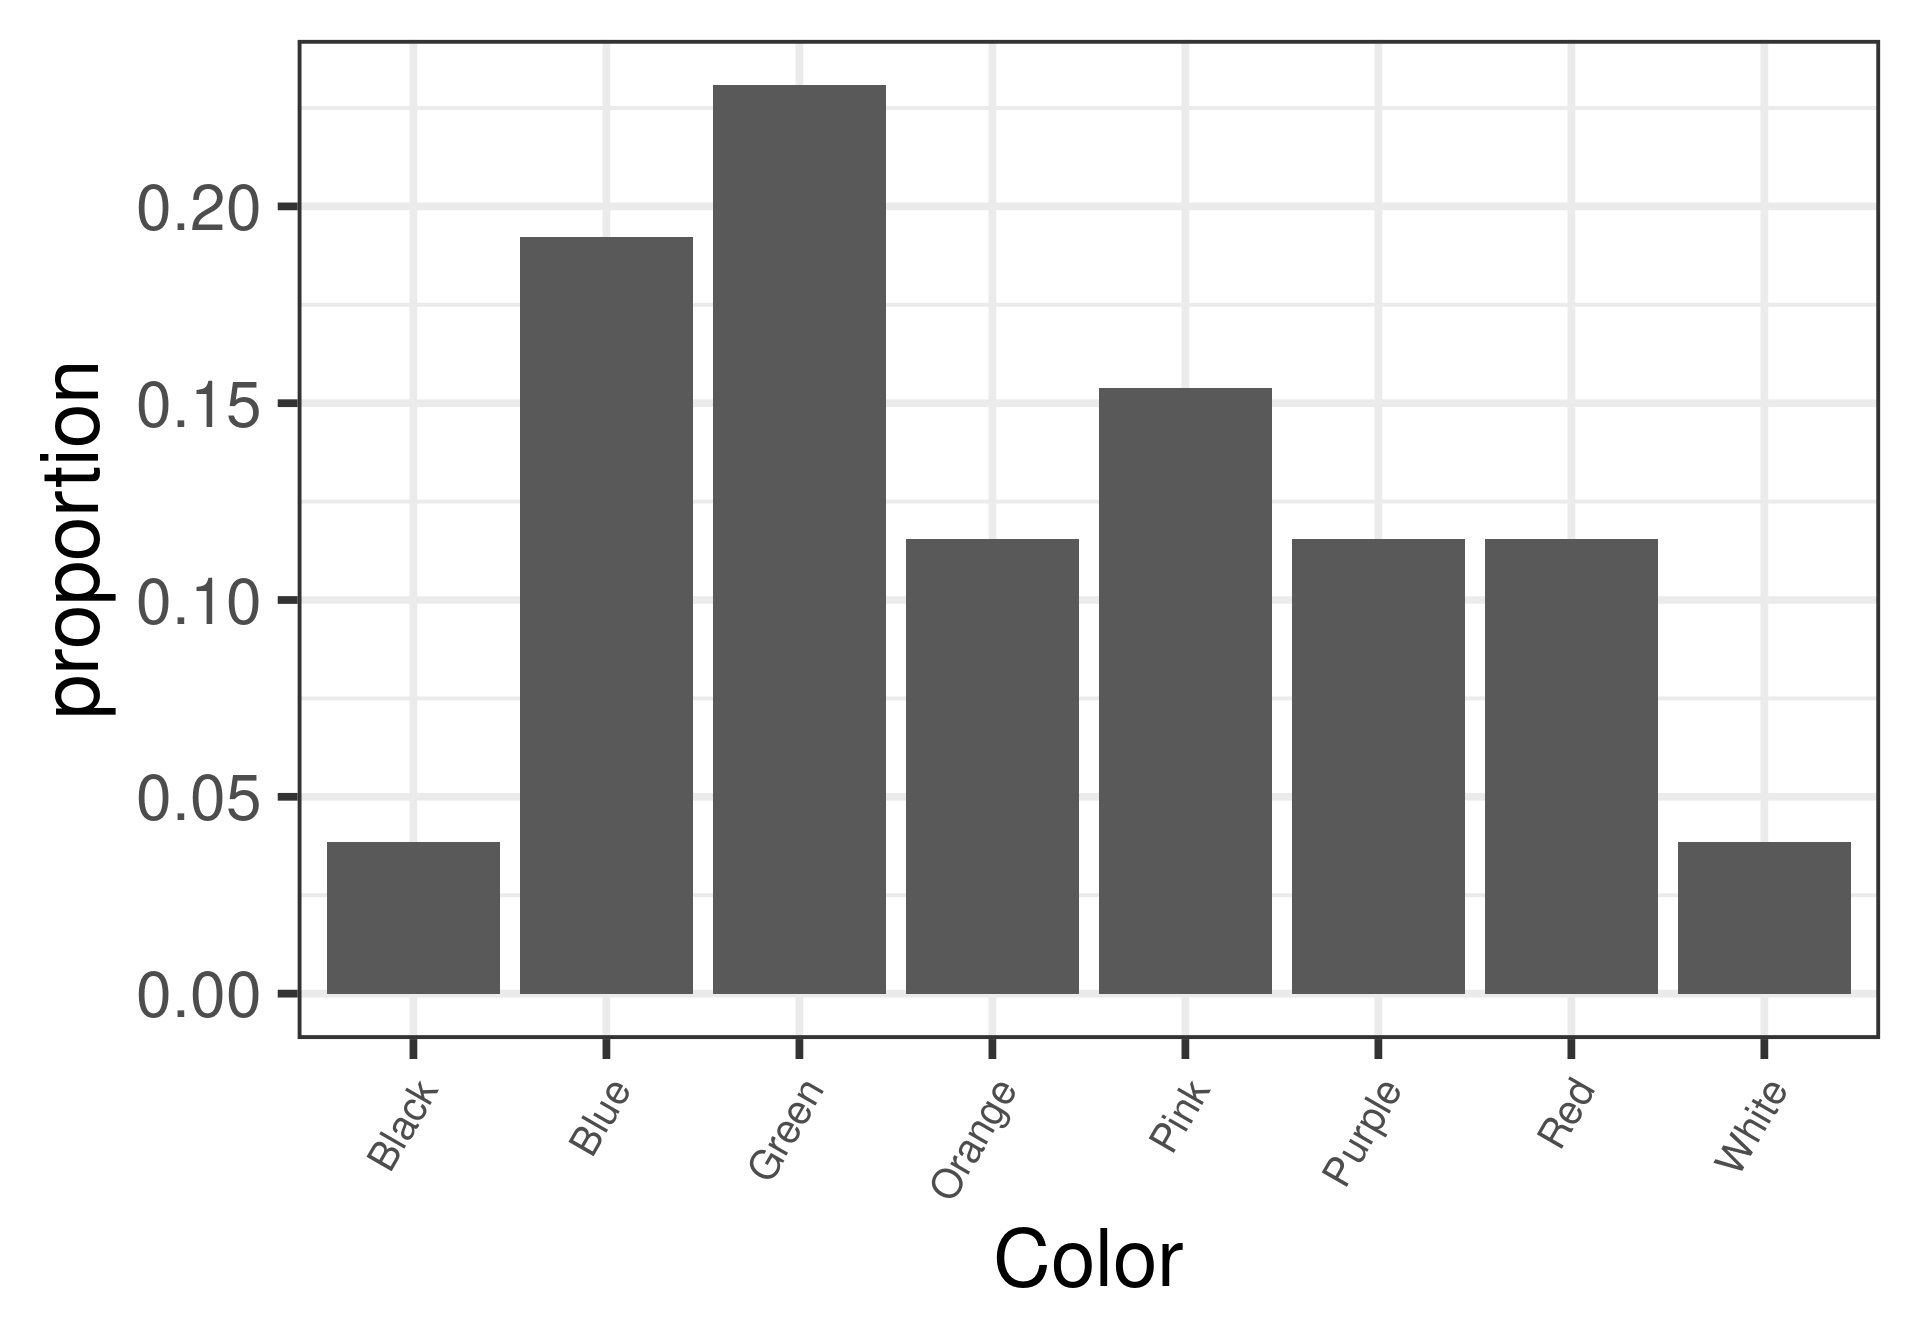
| Color | Freq (%) |
|---|---|
| All Colors | 6.25 |
| Black | 6.25 |
| Blue | 18.75 |
| Green | 18.75 |
| Navy | 6.25 |
| Pink | 12.50 |
| Pink/Brown | 6.25 |
| Purple | 12.50 |
| Red | 12.50 |
- Relative Bar Graph
A Factor
- Frequency Table
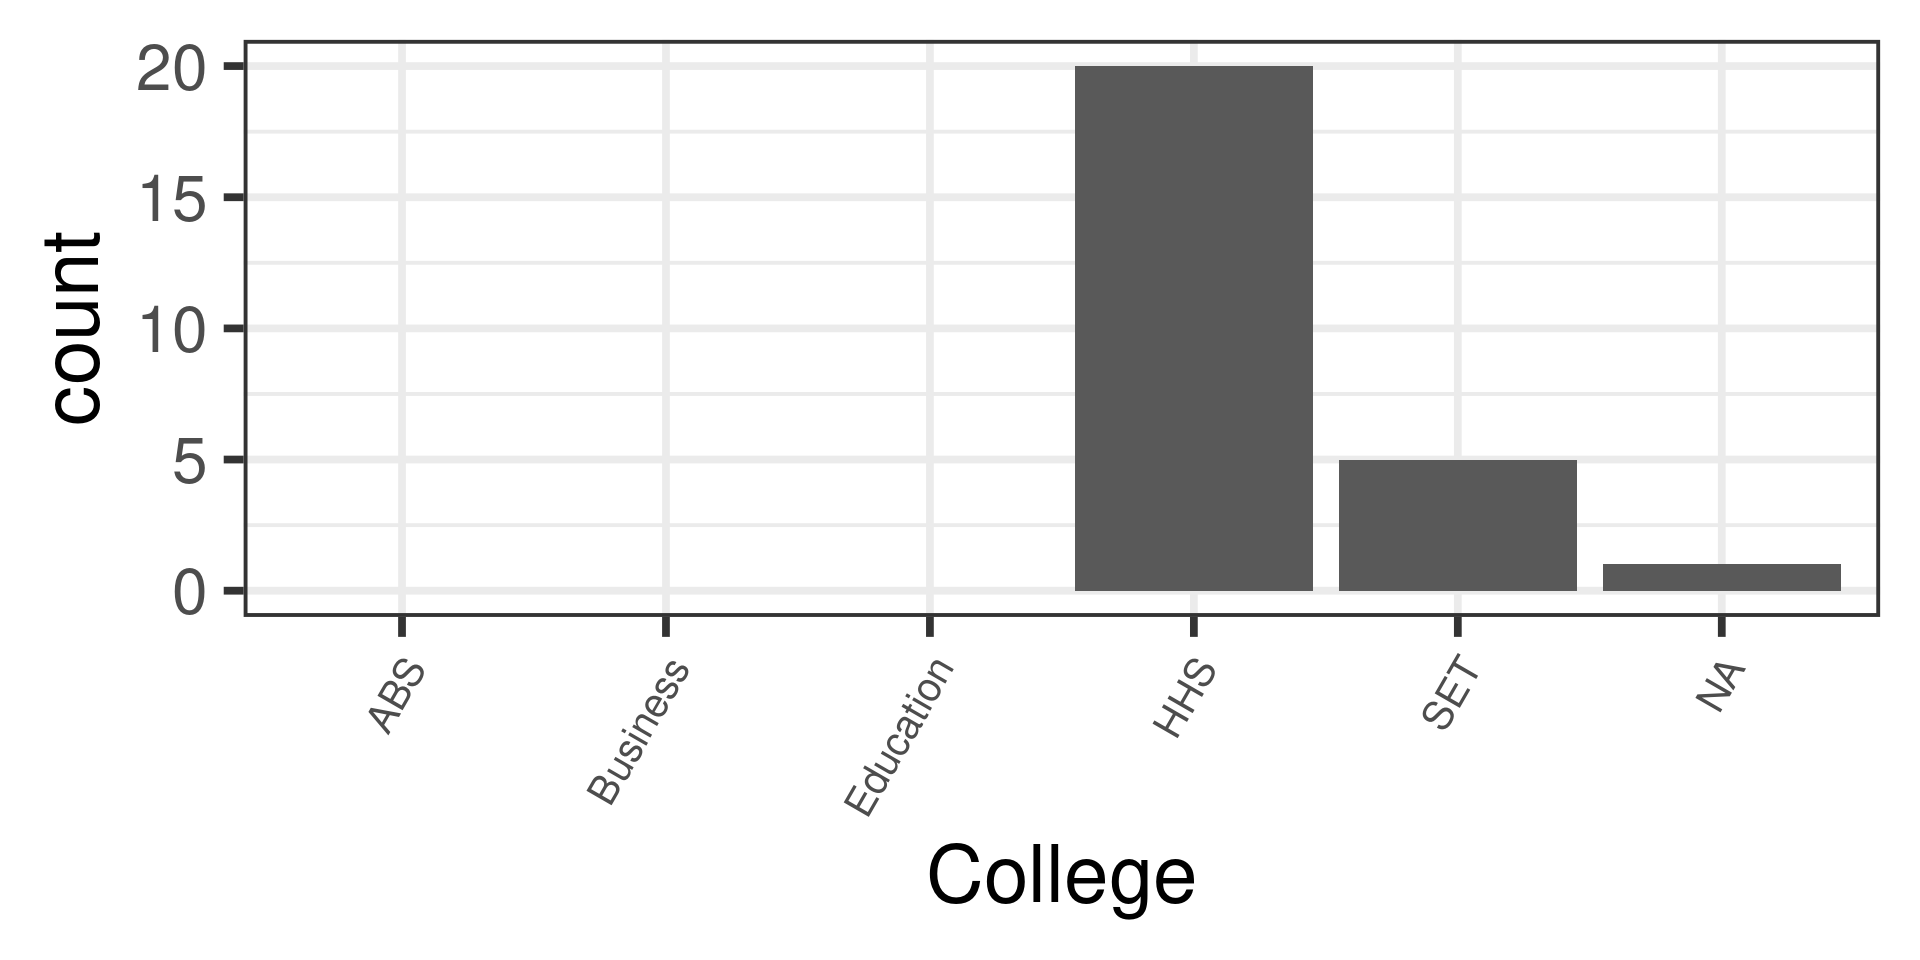
| College | Freq |
|---|---|
| ABS | 1 |
| Business | 0 |
| Education | 0 |
| HHS | 11 |
| SET | 4 |
- Bar Graph
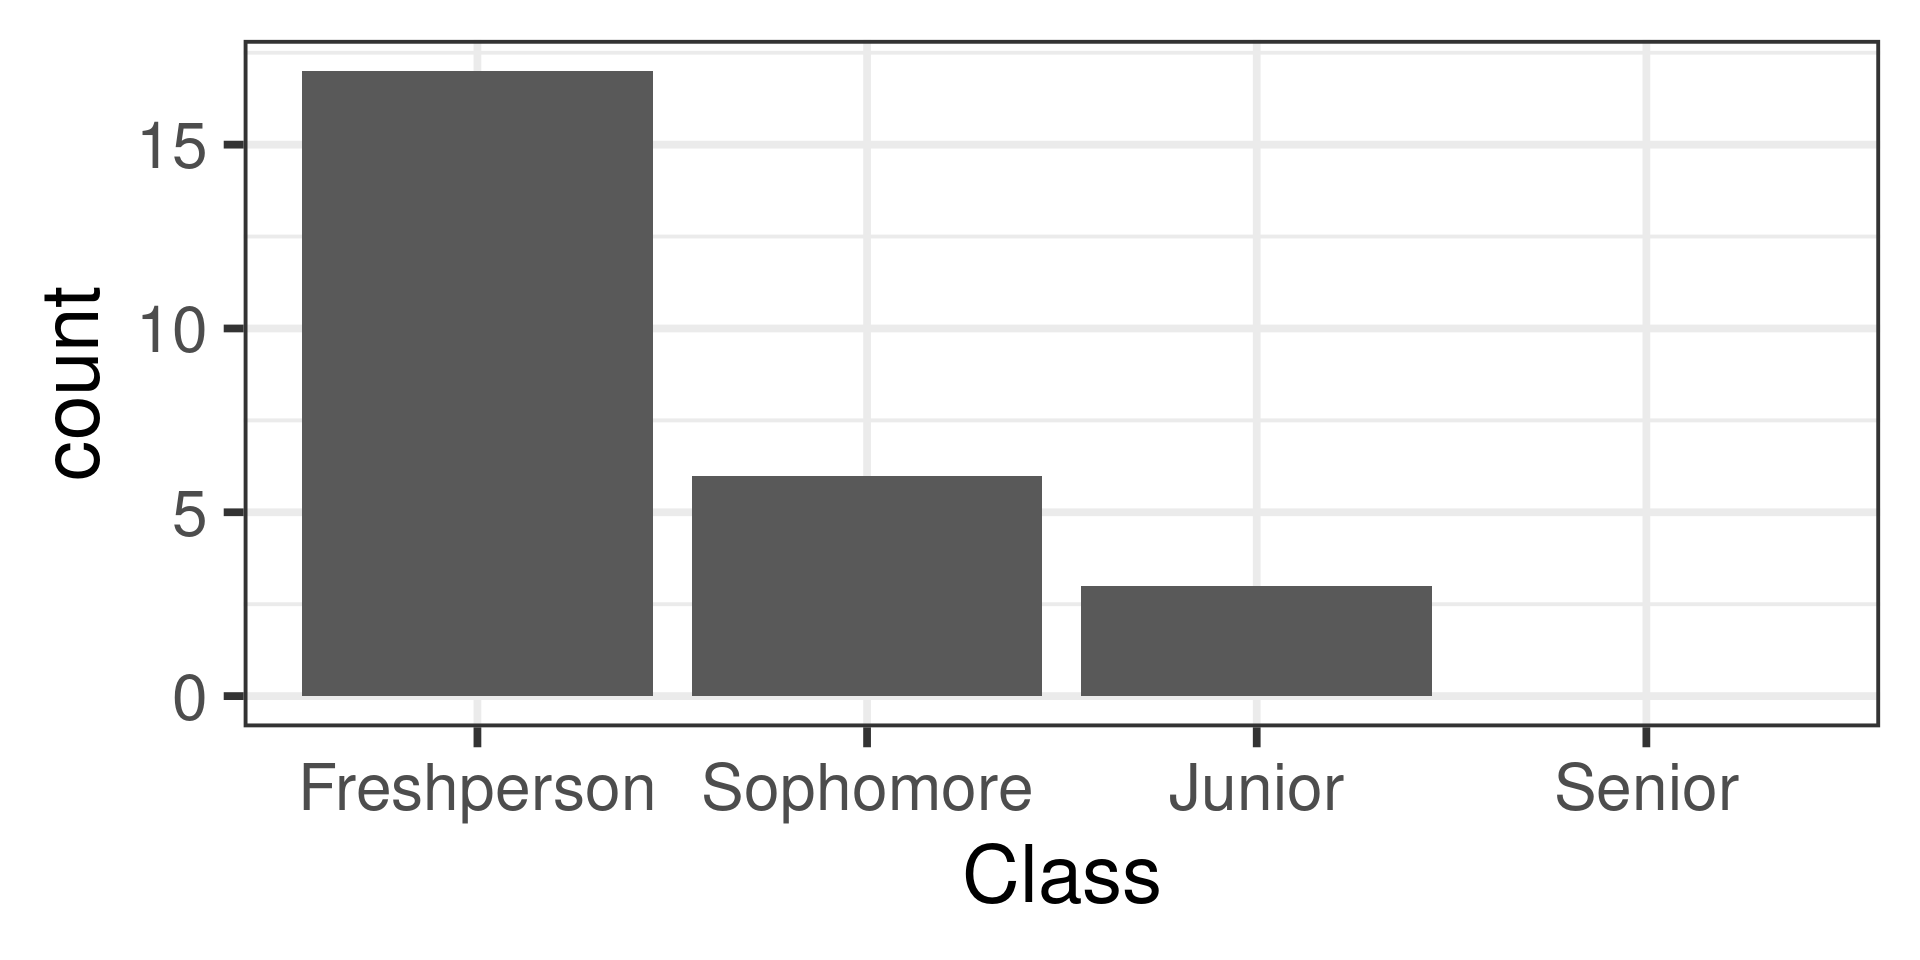
An Ordered Factor
- Frequency Table
| Class | Freq |
|---|---|
| Freshperson | 7 |
| Sophomore | 5 |
| Junior | 3 |
| Senior | 0 |
| NA | 1 |
- Bar Graph
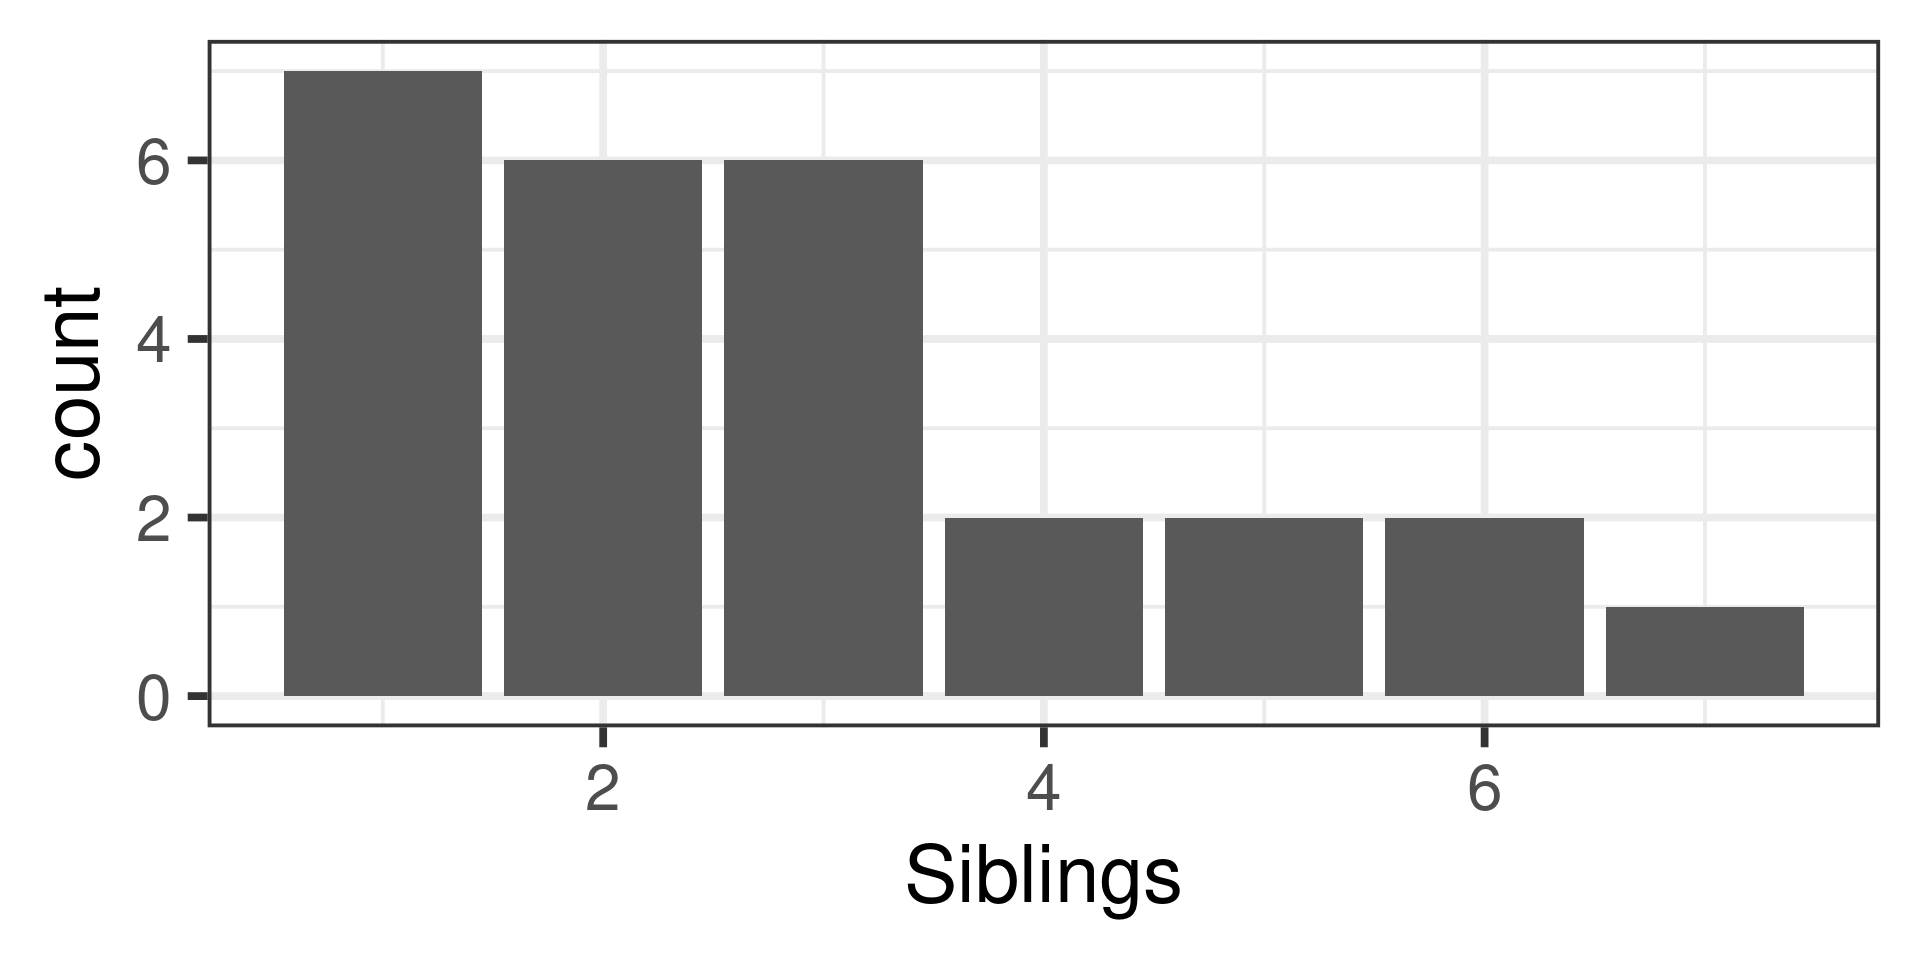
Discrete Numerical Variable
- Frequency Table
| Siblings | Freq |
|---|---|
| 0 | 3 |
| 1 | 4 |
| 2 | 3 |
| 3 | 2 |
| 5 | 2 |
| 6 | 1 |
| 7 | 1 |
- Bar Graph
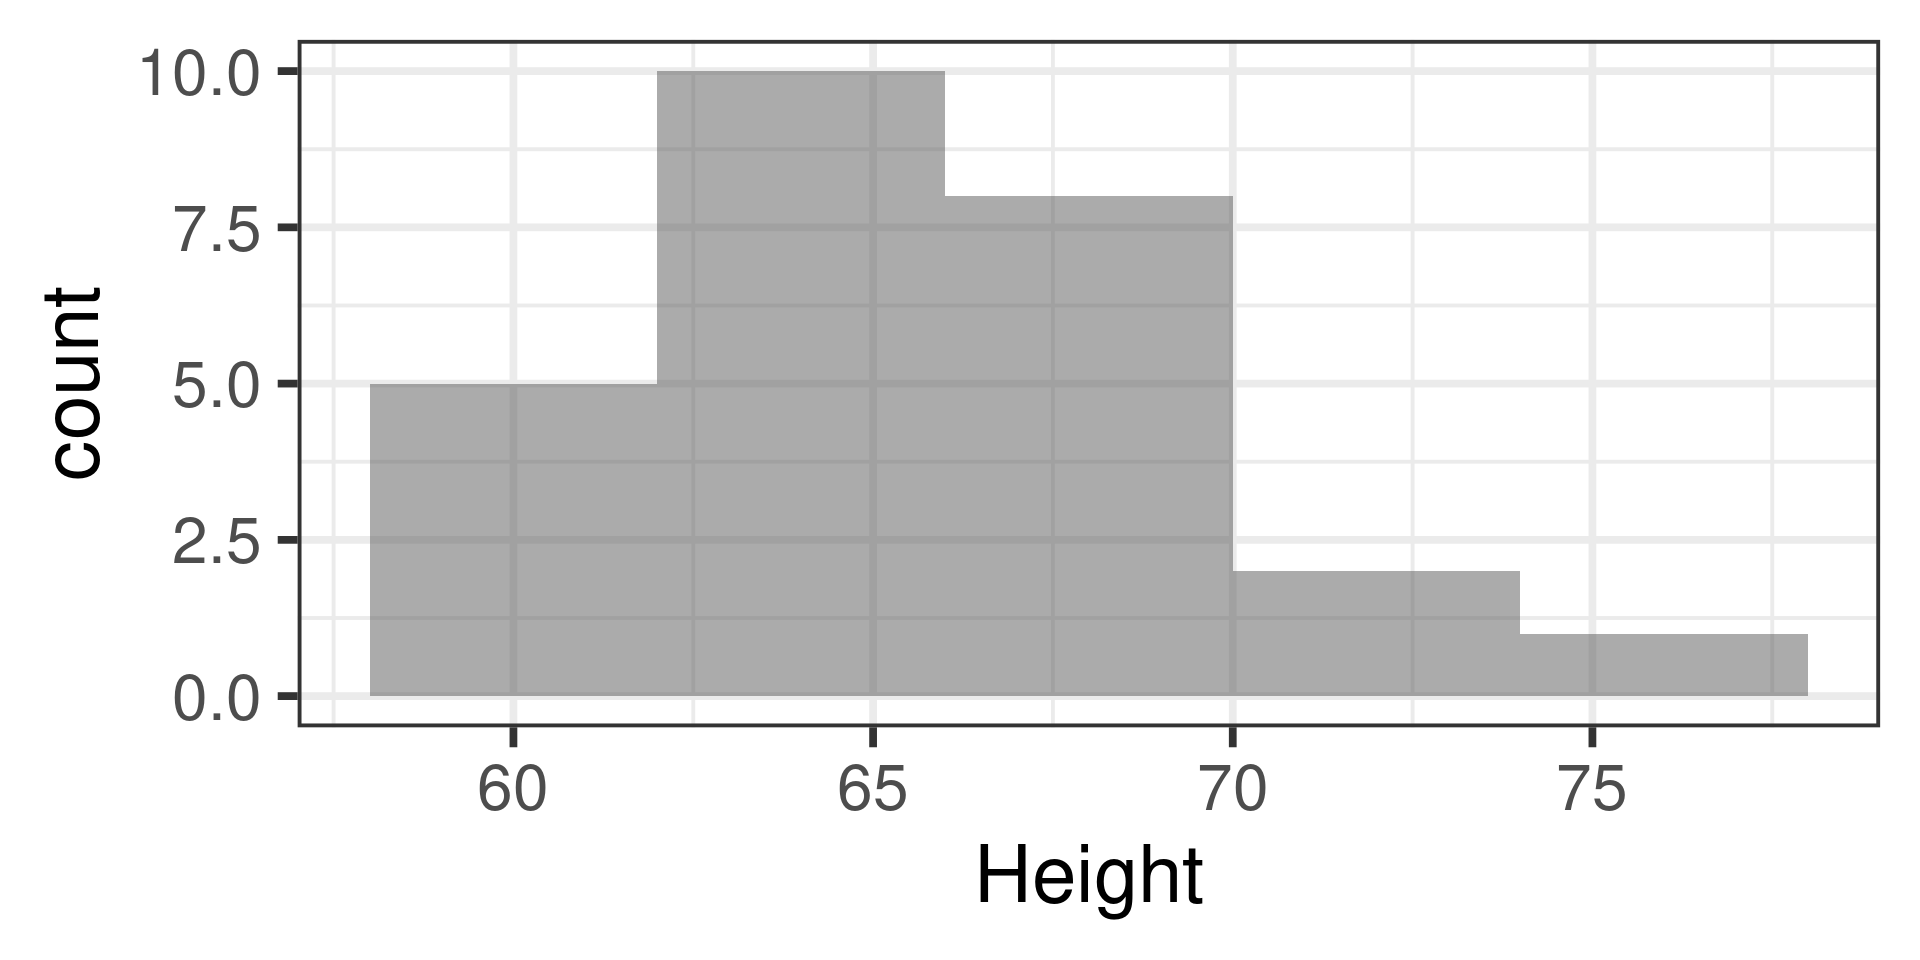
Continuous Numerical Variable
Bin width 1:
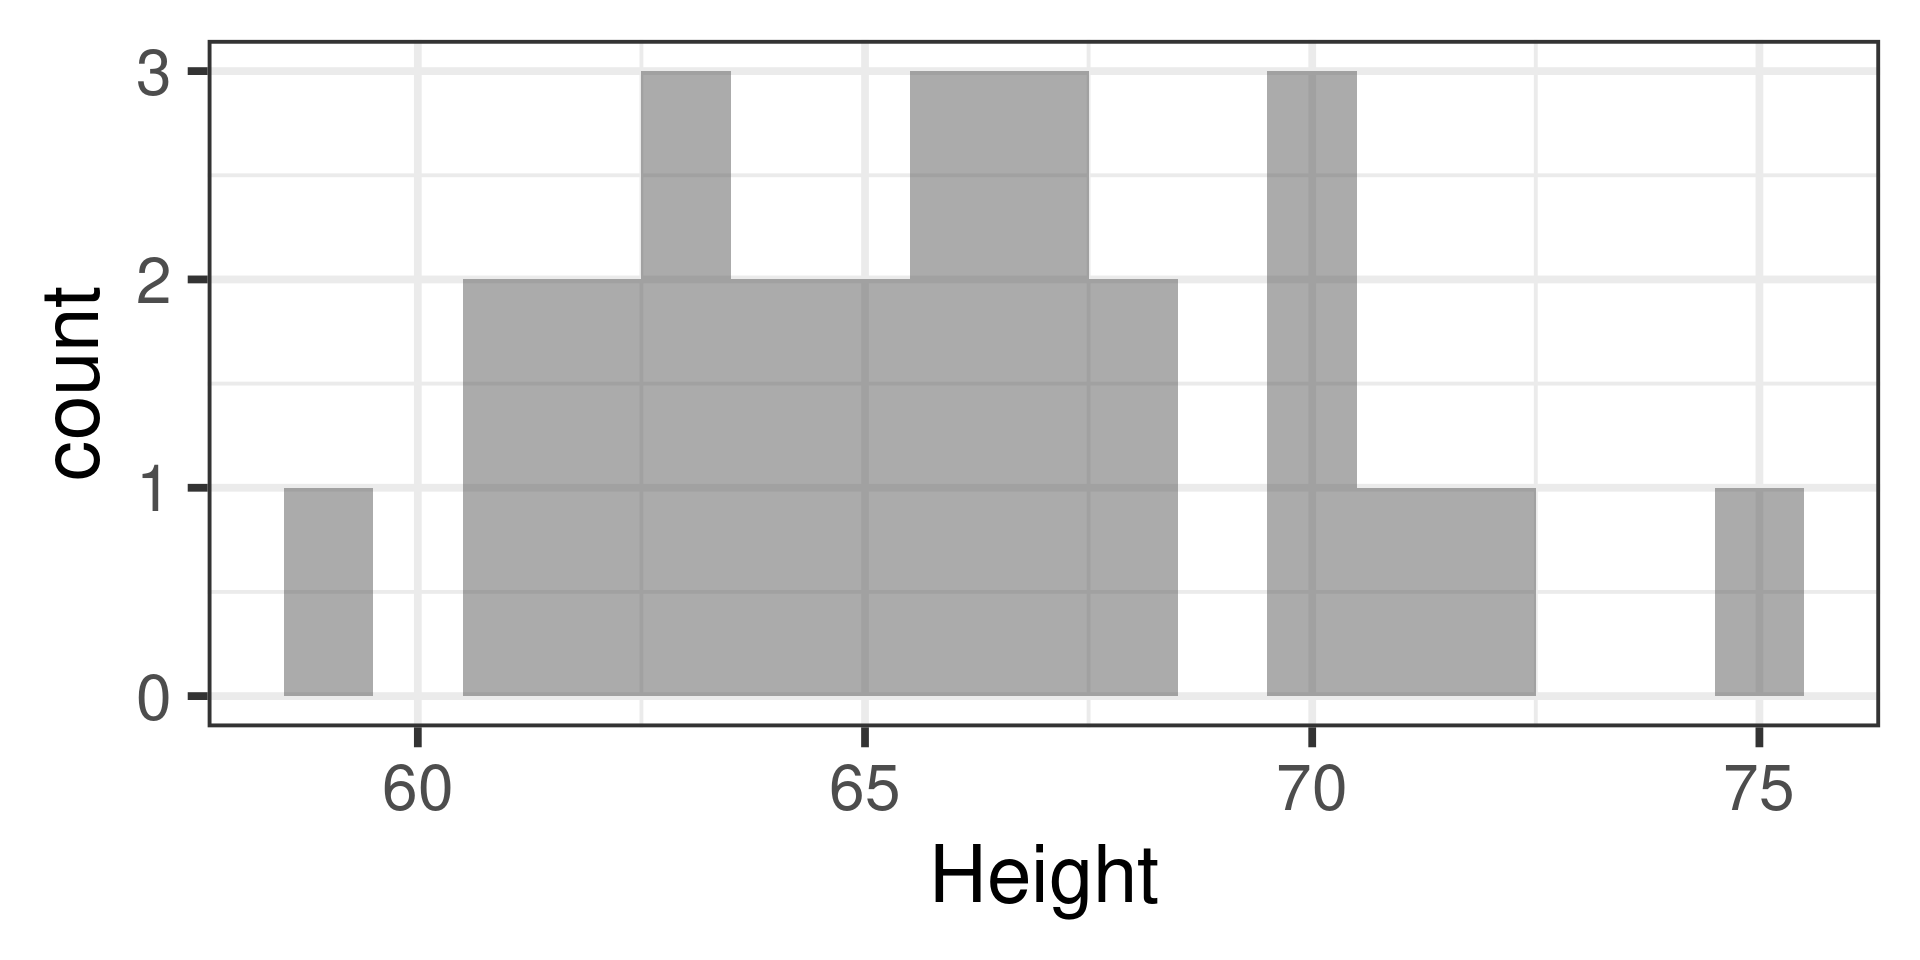
Bin width 3:
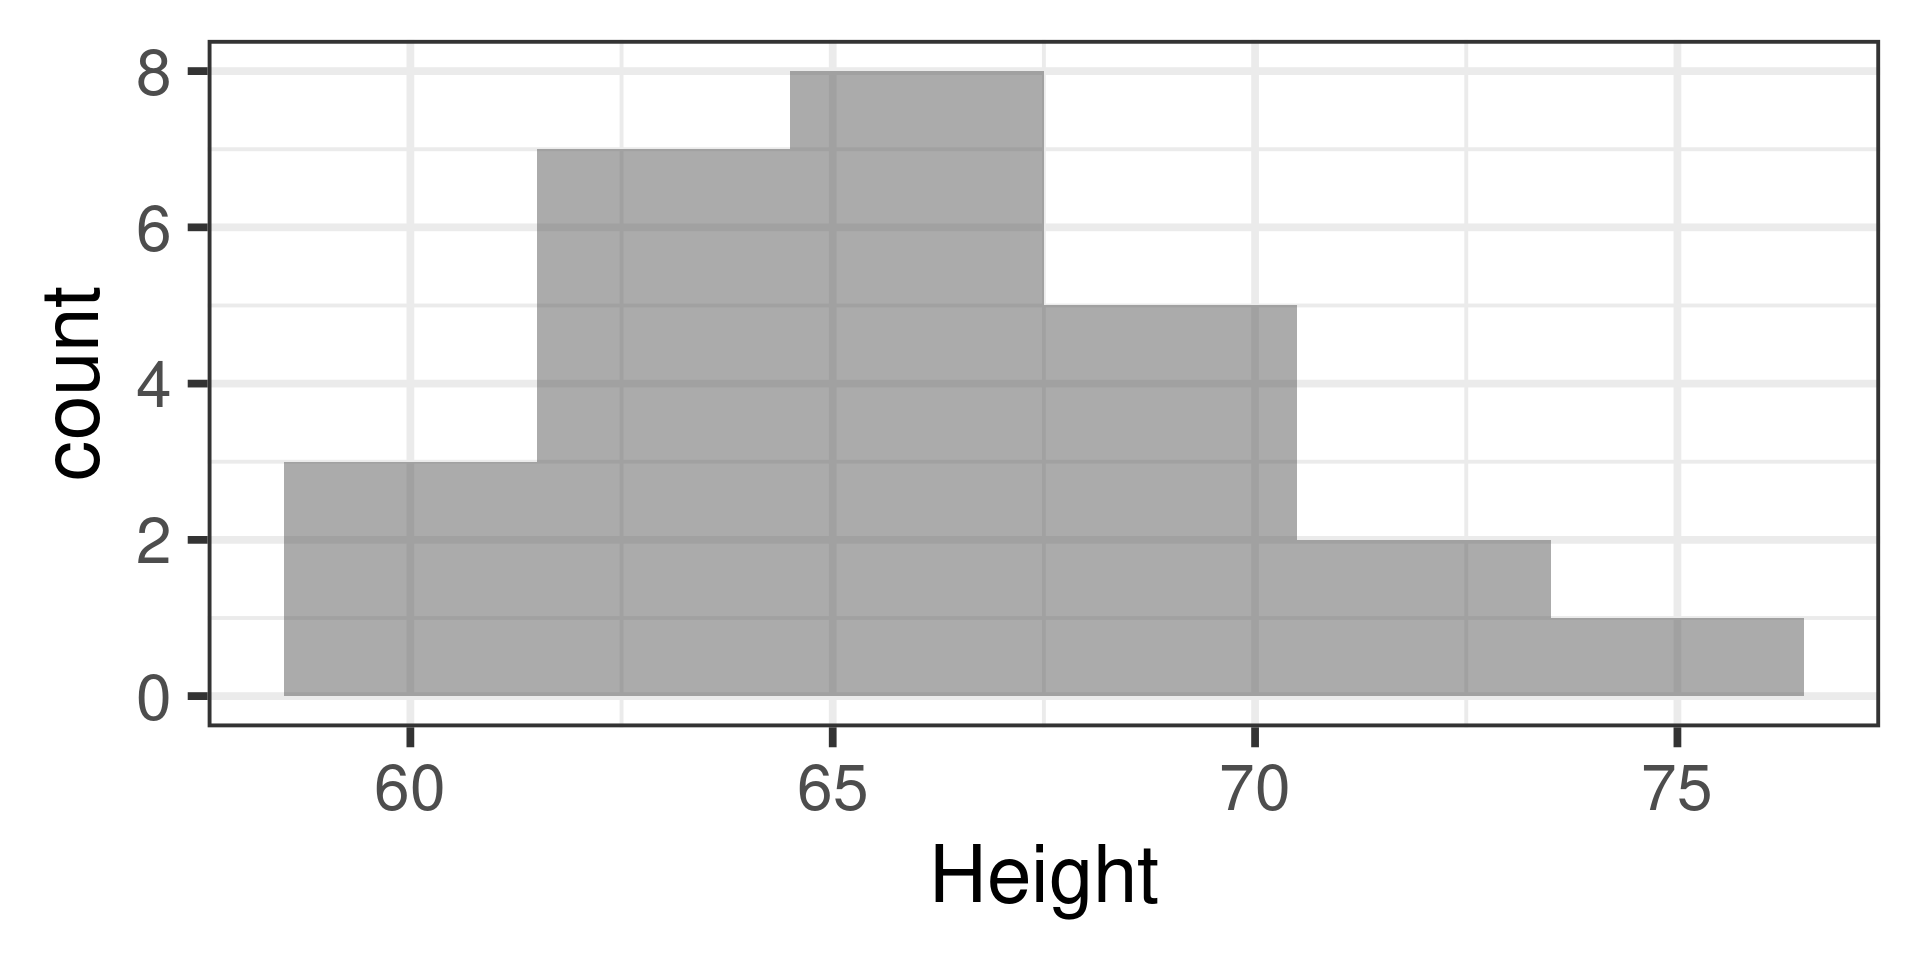
Bin width 2:
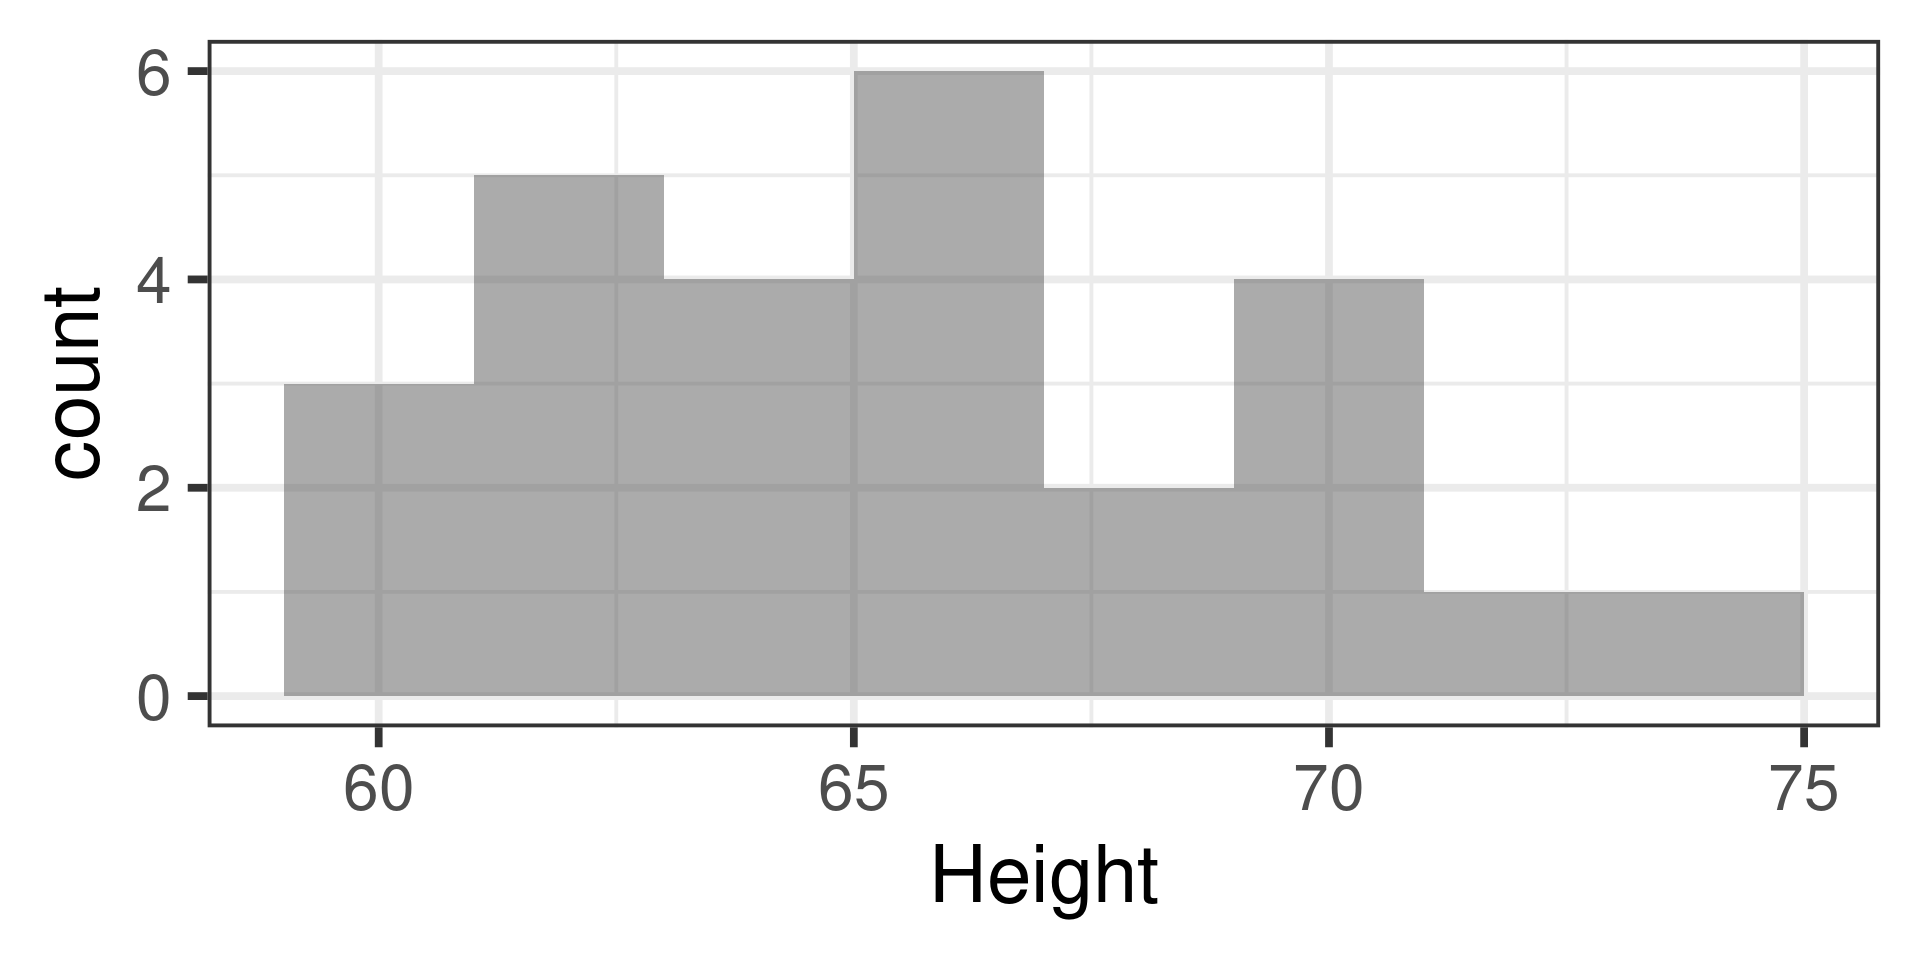
Bin width 4:
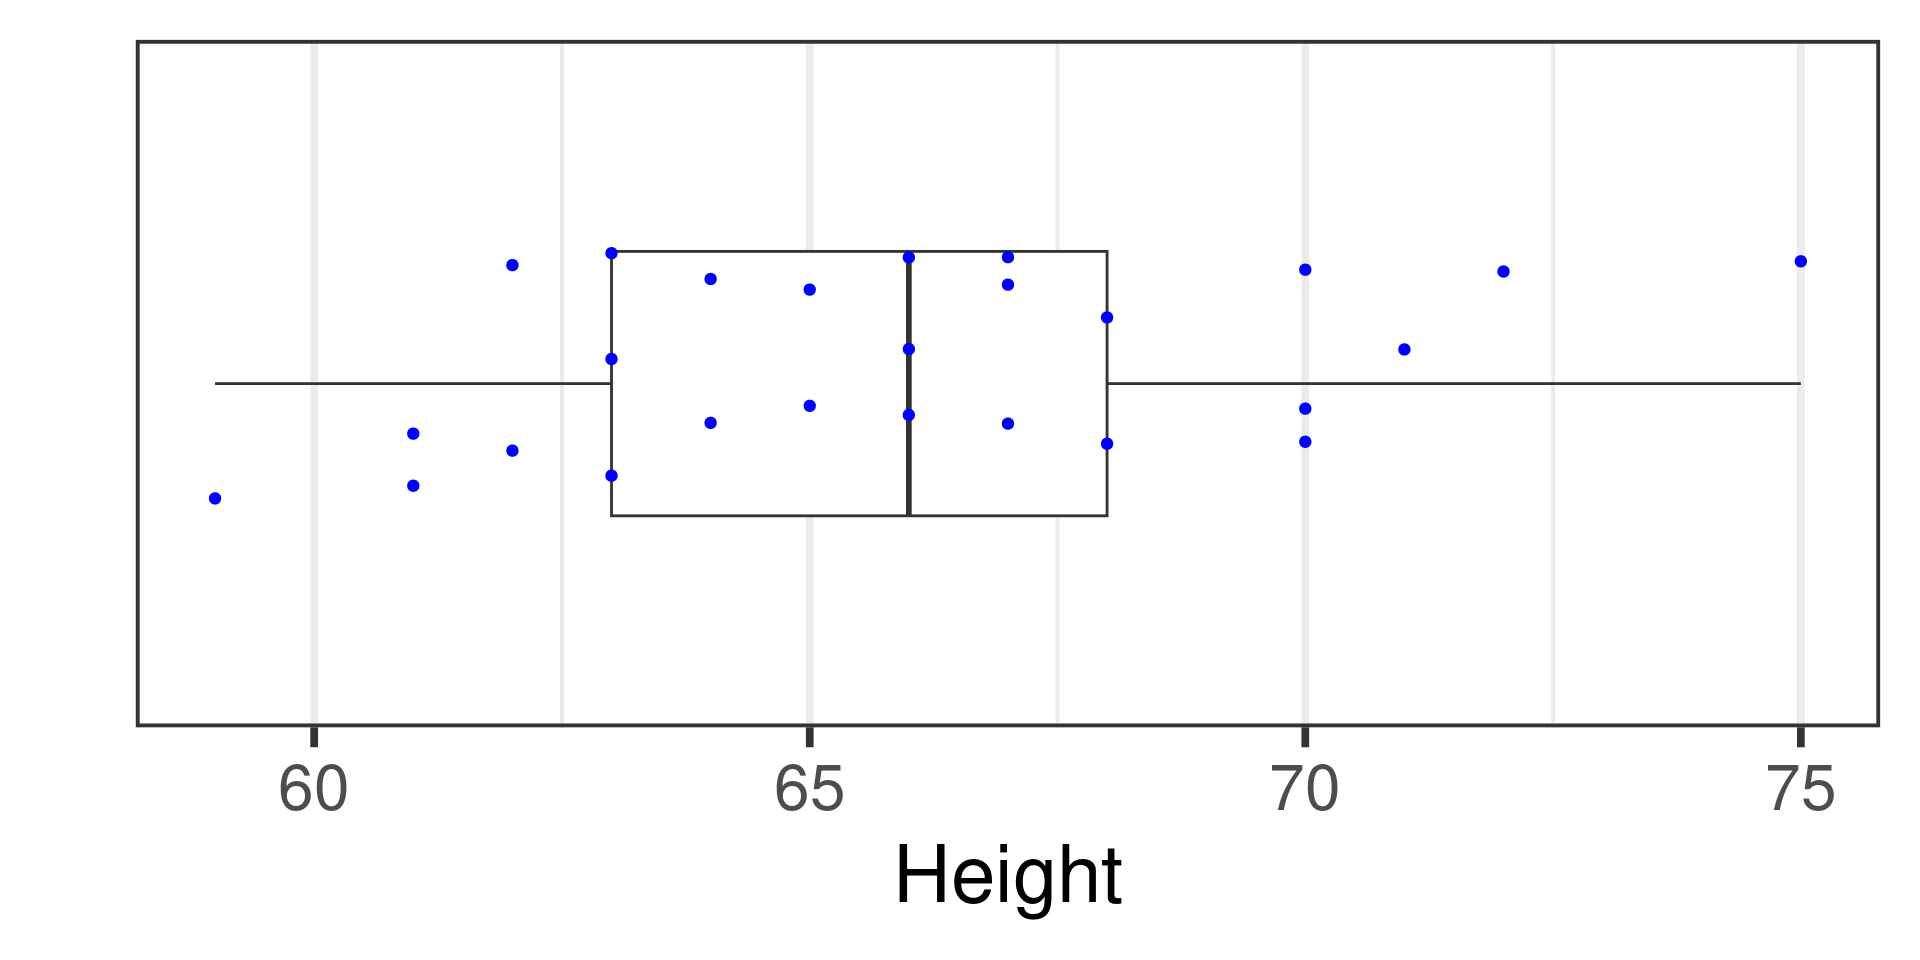
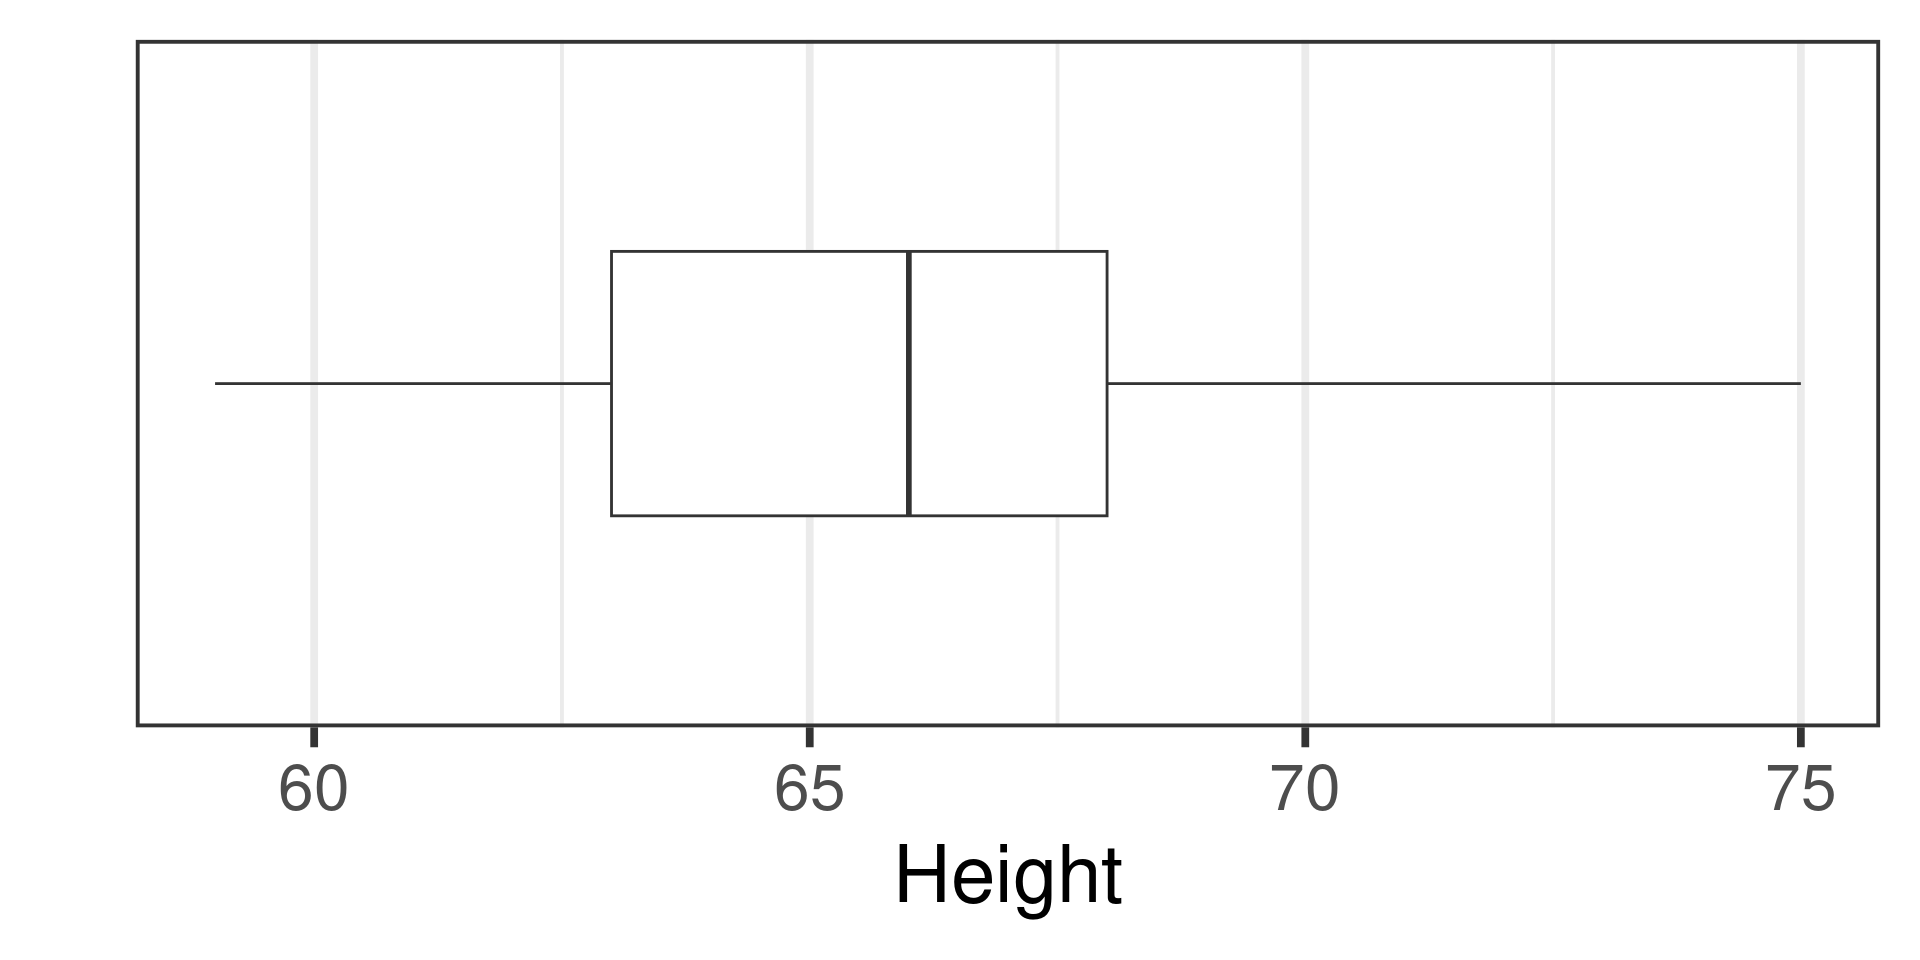
Box-plot
| min | Q1 | median | Q3 | max | mean | sd | n | missing | |
|---|---|---|---|---|---|---|---|---|---|
| 60 | 64.75 | 66 | 69.25 | 75 | 66.5 | 3.794733 | 16 | 0 |
Box-plot
| min | Q1 | median | Q3 | max | mean | sd | n | missing | |
|---|---|---|---|---|---|---|---|---|---|
| 60 | 64.75 | 66 | 69.25 | 75 | 66.5 | 3.794733 | 16 | 0 |